[I don’t fully understand the operation or universe of potential or preferable applications of “Counter-mapping,” but then again, sometimes I have trouble figuring out how to apply GIS tools. It does seem, however. that these concepts could be useful in addressing the interface between local, artisanal users of natural resources, such as fishers, and new conservation needs and programmes. There is a useful list of references at the bottom of this article.]
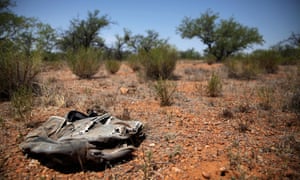
A weathered backpack left behind by a migrant in the Sonoran Desert between the USA and Mexico. Photograph: Alamy Stock Photo
Sara is a 32-year-old mother of four from Honduras. After leaving her children in the care of relatives, she travelled across three state borders on her way to the US, where she hoped to find work and send money home to her family. She was kidnapped in Mexico and held captive for three months, and was finally released when her family paid a ransom of $190.
Her story is not uncommon. The UN estimates that there are 258 million migrantsin the world. In Mexico alone, 1,600 migrants are thought to be kidnapped every month. What is unusual is that Sara’s story has been documented in a recent academic paper that includes a map of her journey that she herself drew. Her map appears alongside four others – also drawn by migrants. These maps include legends and scales not found on orthodox maps – unnamed river crossings, locations of kidnapping and places of refuge such as a “casa de emigrante” where officials cannot enter. Since 2011, such shelters have been identified by Mexican law as “spaces of exception”.
Travelling through tree-covered areas is a slow and arduous process, as is travel through politically unstable areas. Scale on an orthodox map is uniform; counter-maps can represent psychological as well as physical distances that are rarely linear or uniform. In the town of Duvergé in the Dominican Republic, I once interviewed a Haitian migrant who had dealt with civil unrest, a long mountain chain, forests, police checkpoints and clusters of militias (chimères) on his journey across the border. Although geographically his home town was only 177km away, he was psychologically about as close to home as a Londoner is to Murmansk.
Counter-mapping’s ability to capture this fragmentation also makes it a useful tool for documenting physical transformations wrought by climate change. In the Arctic, melting sea-ice is opening up the Northwest Passage to the possibility of greater transcontinental shipping. Questions of sovereignty over these waters are pressing, and the traditional function of maps has been to impose the stamp of a crown on vast swaths of the Earth. In the Arctic, as in Africa and Asia through the 19th century, it suited many Europeans, Russians and Americans to think the land was empty before they arrived. In the mining town of Labrador City, there are curiously named lakes: Tanya Lake, Beverly Lake, Carol Lake. Curious, until you learn that Carol was the wife of the chief geologist of the Iron Ore Company of Canada (IOC). The names date from the 1950s.
Counter-mapping often pays greater attention to “their method” than orthodox mapping. There are more than just Cartesian coordinates in the world. Detailed knowledge of the thickness of ice, places of shelter and predators are engraved in Inuit stories. Indeed, the naming continues; within the great Rapa valley in Sarek, the Swedish wilderness, is a small area recently given the name Rovdjurstorget (Predator Square) because the tracks of all four large predators that exist in the wild in Sweden (bear, wolverine, wolf and lynx) have been found there.
And if a scientist frowns at the mention of storytelling, just remind them of the names of places to be found in anatomical atlases of the brain – the amygdala (the almond) , the hippocampus (the seahorse) , the globus pallidus (the pale globe) . Mapping is eternally linked to stories, and counter-mapping acknowledges the use of more than one knowledge base. It also has the possibility to counter the naïve, sometimes malign, simplicity of state lines. Arctic people in particular know a thing or two about these lines – the Sami were often burdened with paying taxes to three nation states at a time.
One of the fundamental overlaps between the counter-mapping of the Arctic and the journeys of migrants is that in both cases there is no single scientific or technical solution to the problem at hand. Alleviating the problem depends as much on ethics as equations, and Inuit people have different ethical obligations to the Arctic to IOC geologists. The answer to the question “whose woods are these?” is not singular. Counter-mapping at least helps us to give more weight and representation to customs and claims on the land that have traditionally been ignored.
A growing movement seeks to make the tools of science available to everyone (including you)
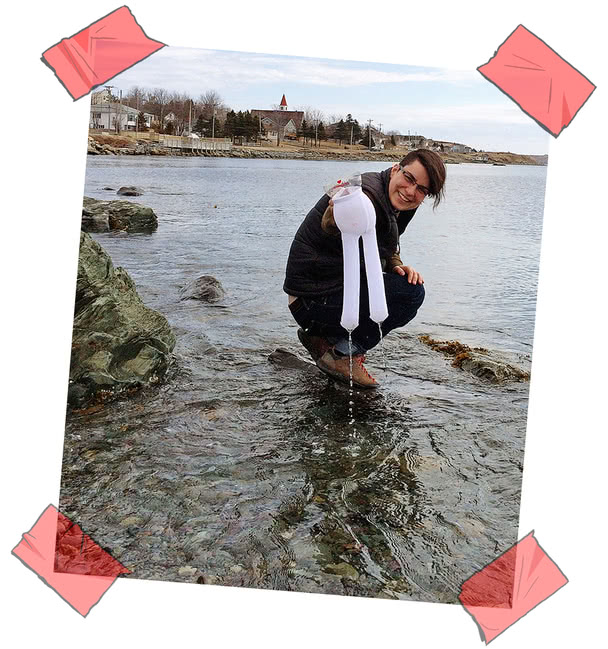
A PAIR of toddler’s tights. That is the most important component of the device that Max Liboiron designed to measure the ocean’s plastic debris.
In 2014 Ms Liboiron, a geographer, took up a job at the Memorial University of Newfoundland on the Atlantic coast. Two years earlier Canada’s Conservative government had passed a bill that weakened environmental protection and cut the budget for monitoring the country’s water and air. Ms Liboiron wanted to help plug the gap. She had no staff and no equipment. But she had a feeling that, if she could get around the second of those problems, she could sort out the first. Given appropriate tools, she suspected, locals would be more than happy to survey the waters surrounding the island for marine plastics. The ocean provides Newfoundlanders with food and jobs; knowing what ends up in the fish they eat and sell is crucial.
Newfoundland is not awash with fancy scientific equipment going begging. Baby stockings, however, are widely available. Attached to half a plastic bottle as a mouth and towed behind a boat, the synthetic tights (cotton will absorb water and sink) sieve surface water for some of the five trillion or so pieces of plastic that are estimated to pollute the world’s oceans.
BabyLegs, as Ms Liboiron has dubbed her contraption, is the sort of do-it-yourself kit being used by an increasing number of concerned citizens seeking to monitor the soil, water and air. Such tools are typically cheaper than the professionals’ alternatives. The Manta Trawls with which scientists skim the oceans for microplastics start at around US$3,500. BabyLegs, which you can put together yourself using instructions from Ms Liboiron’s Civic Laboratory for Environmental Action Research (CLEAR), costs just a few dollars.
But price is only part of the point. The bigger issue is agency. BabyLegs and schemes like it not only provide a cheap way to gather data governments are ignoring. They also offer citizens an active role in doing so; a way to help themselves, and express their commitment to others, on their own terms. It may look scrappy; it may be comparatively primitive (although, increasingly, it is not). But it is liberating. In 1977, in the very heavenly dawn of London’s punk-rock scene, a crude, photocopied magazine told its readers: “This is a chord, this is another, this is a third. Now start a band.” They did so by the thousand. Now that punk aesthetic has come to science.
Big in Japan
Safecast, an NGO based in Tokyo, provides the most comprehensive picture of radiation levels across Japan. Its data come from hundreds of devices, either assembled from Safecast’s kits (which cost $500) or built from scratch using instructions on their website. They consist of a Geiger counter, a GPS unit to log where measurements are made, a simple open-source computer called an Arduino to time-stamp the data and a memory card.
Pieter Franken, one of Safecast’s founders, started to map the country’s radiation levels a few days after the huge earthquake of March 11th 2011. When explosions ripped through the reactors of the tsunami-struck Fukushima Dai-ichi nuclear power plant, Mr Franken, a Dutch computer scientist working in Tokyo, bought a Geiger counter and went on the road. “On my first drive, the readings I was getting were significantly higher than those being reported on TV,” he says. Radiation levels varied dramatically from street to street; in some towns far from the plant they were higher than in those that were close.
The official data were not fine-grained enough to reveal such patterns. Results from Speedi, the government computer system used to predict the path of the radioactive plume from the plant, were considered too inaccurate to share with the public. No one trusted the government’s reassurances when they came.
“I met people on the ground desperate to know radiation levels in their home, school or at work,” Mr Franken says. He contacted two old friends, Sean Bonner and Joi Ito, tech entrepreneurs with colourful and impressive CVs, to talk about what to do. Between them, they cooked up the idea of using volunteers with mobile Geiger counters to collect data and stream them to a website.
Supplies of commercial instruments had, understandably, dried up quickly after the disaster. So Mr Franken patched one together from parts and connected it to an iPhone to get GPS co-ordinates for the data. By the end of the next month he and other volunteers had built a prototype of the “bGeigie”, the first in a series of detectors that they would make available in kit form on their site.
In the six years since the disaster, Safecast has moved from the fringes of respectable science to its mainstream. Two of its members were invited to speak in Vienna in 2014 at a meeting on the Fukushima disaster organised by the International Atomic Energy Agency. In 2016 the team published a paper in the Journal of Radiological Protection. And perhaps most tellingly of all, scientists are adopting their methods. “How Radioactive Is Our Ocean”, a project at the Woods Hole Oceanographic Institution in Massachusetts, is getting people to send samples of seawater from beaches on the west coast. The scientist leading the project, Ken Buesseler, met members of the Safecast team in 2012 shortly after he published a study on radioactive isotopes in the fish and waters off the coast of Fukushima. When he could not raise money from the federal government to look for those isotopes off America’s Pacific coast, he discussed with Safecast how to establish a citizen-science project to collect the data instead.
Citizen science has been around for ages—professional astronomers, geologists and archaeologists have long had their work supplemented by enthusiastic amateurs—and new cheap instruments can usefully spread the movement’s reach. What is more striking about bGeigie and its like, though, is that citizens and communities can use such instruments to inform decisions on which science would otherwise be silent—or mistrusted. For example, getting hold of a bGeigie led some people planning to move home after Fukushima to decide they were safer staying put.
Ms Liboiron’s research at CLEAR also stresses self-determination. It is subject to “community peer review”: those who have participated in the lab’s scientific work decide whether it is valid and merits publication. In the 1980s fishermen had tried to warn government scientists that stocks were in decline. Their cries were ignored and the sudden collapse of Newfoundland’s cod stocks in 1992 had left 35,000 jobless. The people taking science into their own hands with Ms Liboiron want to make sure that in the future the findings which matter to them get heard.
Swell maps
Issues such as climate change, plastic waste and air pollution become more tangible to those with the tools in their hands to measure them. Those tools, in turn, encourage more people to get involved. Eymund Diegel, a South African urban planner who is also a keen canoeist, has long campaigned for the Gowanus canal, close to his home in Brooklyn, to be cleaned up. Effluent from paint manufacturers, tanneries, chemical plants and more used to flow into the canal with such profligacy that by the early 20th century the Gowanus was said to be jammed solid. The New York mob started using the waterway as a dumping ground for dead bodies. In the early part of this century it was still badly polluted.
In 2009 Mr Diegel contacted Public Lab, an NGO based in New Orleans that helps people investigate environmental concerns. They directed him to what became his most powerful weapon in the fight—a mapping rig consisting of a large helium balloon, 300 metres (1,000 feet) of string and an old digital camera. A camera or smartphone fixed to such a balloon can take more detailed photographs than the satellite imagery used by the likes of Google for its online maps, and Public Lab provides software, called MapKnitter, that can stitch these photos together into surveys.
These data—and community pressure—helped persuade the Environmental Protection Agency (EPA) to make the canal eligible for money from a “superfund” programme which targets some of America’s most contaminated land. Mr Diegel’s photos have revealed a milky plume flowing into the canal from a concealed chemical tank which the EPA’s own surveys had somehow missed. The agency now plans to spend $500m cleaning up the canal.
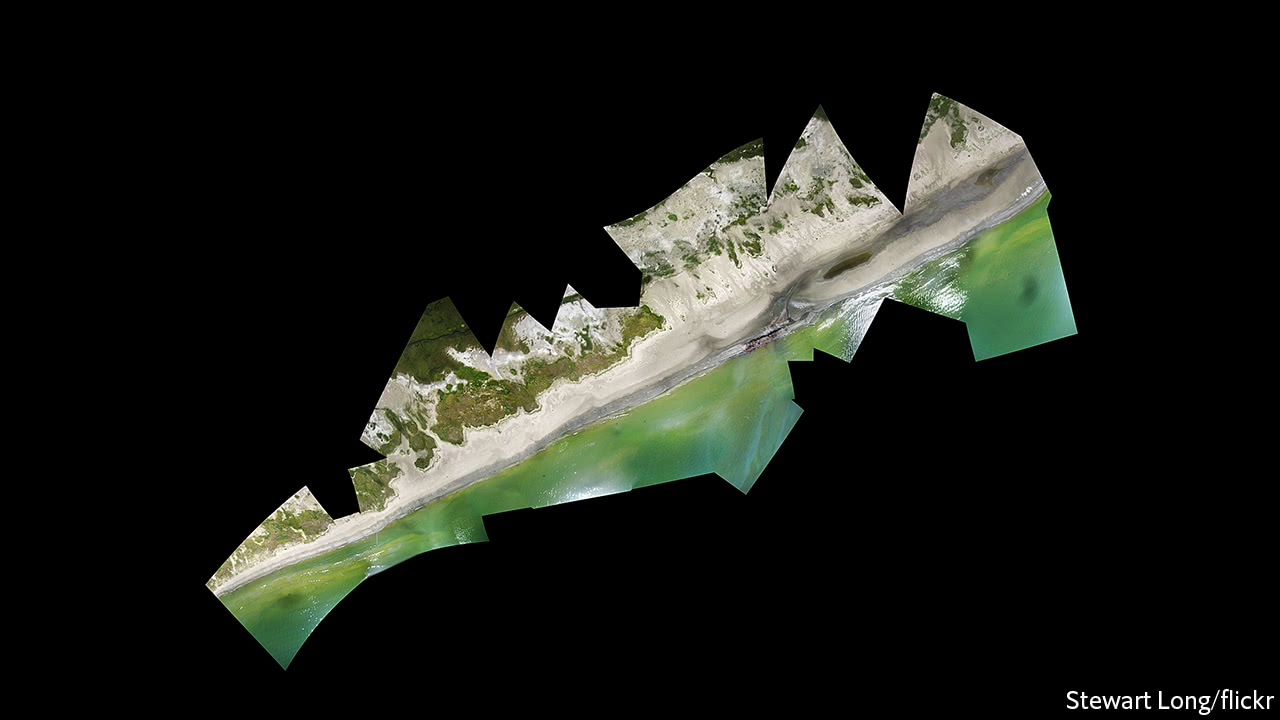
Jeffrey Warren, who created MapKnitter, is one of the founders of Public Lab. The group was set up to help locals map the devastation caused by the oil spill in the Gulf of Mexico in 2010. When the Deepwater Horizon rig exploded, Mr Warren was studying digital cartography as part of a master’s degree at the Massachusetts Institute of Technology. Wanting to help but lacking local knowledge, he called the Louisiana Bucket Brigade, an environmental group in New Orleans, and was put through to Shannon Dosemagen. The brigade is named after the plastic buckets it provides to residents concerned about refineries in the area to help them in gathering samples for laboratory analysis. This has often revealed levels of toxic chemicals, such as benzene, many times higher than those allowed by law. Those data have helped local people, who are often poor and black, to lobby for change.
Tapping in to her experience with the brigade, Ms Dosemagen, who is now Public Lab’s executive director, rapidly organised training sessions in a New Orleans park. Cameras on balloons and kites began snapping the oil’s progress; MapKnitter joined the pictures together to show the impact of the slick (see photo above). Seven years on, Public Lab still springs into action after industrial accidents. Within days of Hurricane Harvey’s landfall in Texas last August coastguards asked Mr Warren for volunteers to help track chemical spills by combing through aerial photos.
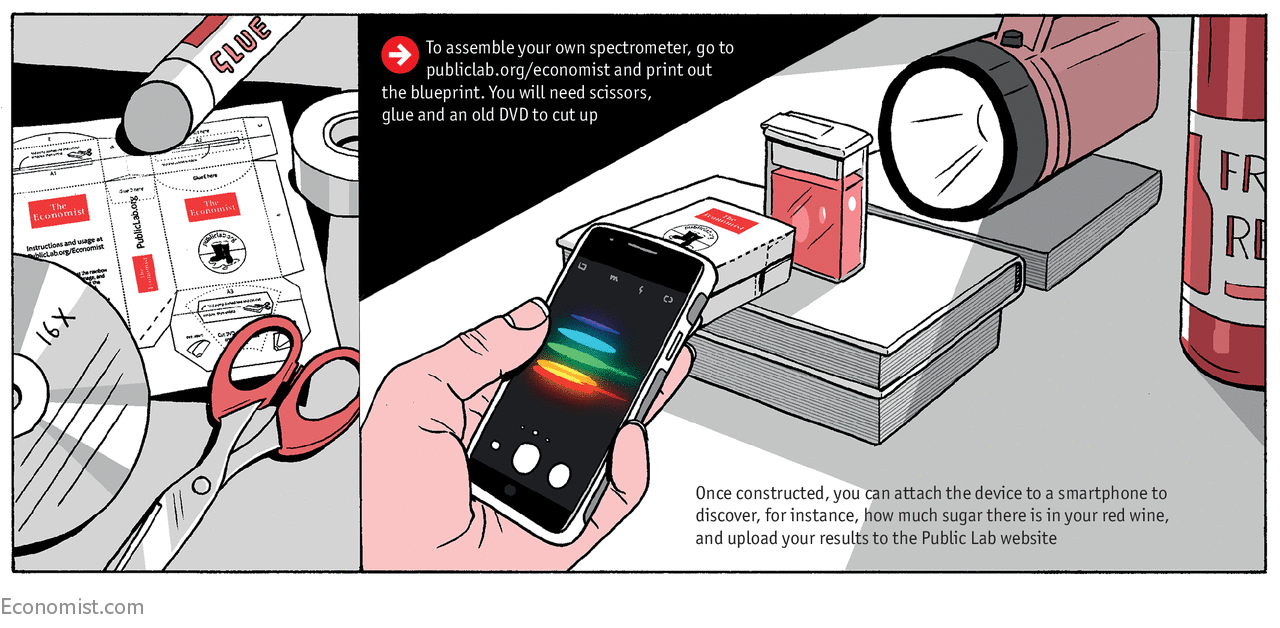
Public Lab’s website now hosts discussion boards on topics that range from finding decibel meters for smartphones to detecting metal ions in water, along with a range of impressive tools. In line with its do-it-yourself ethic, the site offers no ready-built equipment; those who build their own devices, Public Lab believes, are more likely to use them. There are instructions for converting a camera to take infrared images that will help determine crop health as well as for spectrometers which can show up the chemical composition of a liquid or gas by analysing light shone through it. Using a design PublicLabhas kindly made available at its website to readers of The Economist, you can build one yourself, either just for the fun of it, or to measure the sugar content of your wine, or for some punk’d up purpose of your own.
A similar ethos is also beginning to seep into university labs and research institutes. Cheap 3D printers and computer-aided design programs that allow design files to be shared online mean that ever more apparatus can be made in the lab, rather than ordered from a catalogue. The economic argument for doing so is compelling. A plastic test-tube rack can cost more than $20. Downloading one of the many different files for the rack of your choice and printing it costs a tenth of that. A $1,000 laboratory jack for lifting and levelling equipment can be made for $5.
X-ray spex
It is not just simple pieces of lab equipment that can be printed. Earlier this year Tom Baden of the University of Sussex and his colleagues published plans for a 3D-printable fluorescence microscope, called FlyPi, which uses ultraviolet light and fluorescent dye to improve its analysis of samples. Mr Baden estimates that it can be set up for less than $250. Flashy commercial microscopes on the same lines can cost thousands of dollars. Mr Baden, a neuroscientist who studies the eyes and brains of zebra fish, says that although the quality of a FlyPimay not be that of a commercial model, the low cost means that his lab can have several extra microscopes on the go at once alongside the high-spec one they already had.
“Open hardware” like the FlyPi is a boon for scientists in poor countries. Mr Baden and fellow neuroscientists Lucia Prieto-Godino and Sadiq Yusuf founded TREND in Africa, an NGO that organises summer schools for researchers. Courses on open labware begin with building a printer which can itself be made largely from printed parts. Printed scientific tools can be repaired cheaply, as can the printer.
Joshua Pearce, an engineer at Michigan Technological University in Houghton, believes the time is now ripe for change. Even mass-produced plastic trinkets and household goods are cheaper to print than to buy. “If we can beat the shower curtain ring-makers,” he says, “the equipment manufacturers have got no chance.”
Mr Pearce, an early advocate of open hardware, is pushing the concept hard. Atomic layer deposition (ALD) is a method of building up very thin, uniform films on a surface. In chip manufacturing, the process can lay down transistors that are no more than a 100 atoms across. Engineers are exploring its potential for making thin, wearable sensors, implants and drug-delivery devices.
Many researchers would love to get their hands on a system but, at a cost of $250,000, few can afford it. That cost reflects the sophistication of the kit required to carry out the enterprise. ALD must take place in a carefully controlled vacuum. Mr Pearce, however, wants to produce one that anyone can make in the lab for a fraction of the cost with printable plastic parts.
Hundreds of scientists like Mr Pearce and Mr Baden are uploading their plans for instruments to the internet, where they are scrutinised by citizen scientists hoping to improve the tools they are using, and thus the things they can study, monitor and make a fuss about. As new, cheaper, easier-to-use instruments become available, more people across the world will step into the breach as governments threaten to scale back their efforts to monitor the environment and set their own agendas.
In Chile, Exploratorio Sombrero hopes to map poorer neighbourhoods of Melipilla, the city where it is based. In Indonesia, Lifepatch has helped farmers whose land was engulfed by a volcanic eruption. Safecast is growing, too. In April, it unveiled a solar-powered device that can detect levels of particulate air pollution as well as radiation. Within two years, Safecast plans to have more such sensors in America than the EPA. That will improve national statistics at a time the government shows little interest in doing so; more important, it will empower communities which never had the knowledge to affect their futures before.
“LACNIC is the organization responsible for assigning and administrating Internet resources in Latin America and the Caribbean in accordance with the rules developed by the regional community.
“Born as an initiative of Internet pioneers from different countries of our region, the organization is strongly committed to Internet development and stability, cooperating and articulating with all stakeholders.”
There is no definition of the acronym FRIDA.]
From idea to implementation: Open Data as a way to improve citizen engagement
FRIDA has made it possible to go from idea to reality. The University of the West Indies at Mona, Jamaica wanted to promote citizen participation in order to improve the national budgeting process and encourage transparency in the information on the use of Jamaica’s public resources.
They submitted their project to FRIDA’s call for proposals and were selected to receive a FRIDA grant. Indianna Minto-Coy, Senior Research Fellow at the University of the West Indies at Mona and one of the promoters of the project titled “Open/Participatory Budgeting for Improved Transparency and Civic Engagement in Jamaica,” told LACNIC News that “Funding received through FRIDA has been essential in moving from idea to implementation.”
According to Minto-Coy, the initiative proved that open data can have a transformative effect on society, as it promotes greater civic engagement and commitment.
What is the Project about and which are their main objectives?
The project aimed to assess the potential for the use of open data principles and international best practices in participatory budgeting to affect budget governance. This towards greater civic engagement and government transparency.
What advances were you able to achieve after receiving Frida´s grant?
Prior to Frida’s support, the project existed only as an idea. Funding received through Frida has been essential in moving from idea to implementation. Through this we’ve been able to: demonstrate the potential of open data for improved financial management, transparency and civic engagement in Jamaica; benchmark the current budget governance process in Jamaica using the International Budget Partnership’s Open Budget Initiative; and use Open Spending platform to publish and then demonstrate budget data in an open format through collaboration with the Ministry of Finance
Which results did you get from the focus groups and mobile surveys you carried out?
We had four focus groups and the implementation of a survey via the mobile phone (reaching 1749 of a population of a little under 2.8 Million). These demonstrated that a clear appetite exists for information via open data. Jamaicans as a whole have a desire to be more involved in national budget governance and crave more information. The findings also substantiated our initial view that greater access to information and inclusive governance hold the potential to increase trust and citizen willingness to become more active citizens. The implications for the desire to become more active citizens (e.g. increased desire to pay taxes) were among the points highlighted from the study.
Importantly though, while demand exists for open budget data, data providers (be they governments, NGOs or the private sector) also need to go beyond simply opening data to actually focusing on the ways in which users and potential beneficiaries engage with open data. Data visualization tools such as the bubble map we created were shown to have the potential to increase the use and understanding of open data and ultimately, the extent to which open data can have a transformative effect on society. To this end, we found a role for ICTs, mobile technology and new media as tools for citizen engagement and information-raising around open budget data. Such visualizations, their dissemination and the spread of their existence via mobile phones offer groups who may not be engaged in the budget governance process to understand more about the national budget and budget process. To this end, data visualization tools can help to overcome some of the traditional divides that have featured in ICTs over the years.
Finally, the act of engaging citizens via the mobile phone became a part of the intervention and awareness raising behind open budget data itself with persons then visiting our Facebook page to gain more information about the project itself. As such, the mobile phone was shown as serving an important role in enhancing the value and ease of research on open data principles and the wider open data for development movement. In fact, the act of implementing the mobile survey over smart phones, turned out to be important, not only for gathering information but the survey itself also became a knowledge-raising tool as it relates the value of open budgeting and transparency.
What was the repercussion of the Project within the government?
Support came from the government through the Ministry of Finance in accessing budget information. However, there has yet to be much take up of the project and somewhat expectedly given its sandwiching by national and then local government elections. However, while the FRIDA funding has ended, there is room to disseminate the findings and implications to the government ahead of the next budget cycle.
Which are the next goals to be achieved?
Following from the previous response, we did towards the end of this round of FRIDA funding, manage to secure the support of a political representative who has agreed to the implementation of a participatory budget pilot using the Constituency Development Fund. The aim is to secure additional funding to implement this aspect of the study. The potential for getting the attention of government and political leaders towards more directly impacting government will be even greater. Further, there is potential for the study to be implemented across a wider number of Caribbean and Latin American nations, given that the mobile carrier used has a presence across the wider Caribbean.
How would you summarize your experience with Frida?
The experience with FRIDA has been a very rewarding one. The FRIDA staff have been extremely professional and helpful in negotiating through this project. The focus has been on helping us to navigate the parameters and requirements of funding towards the successful completion of the project and accomplishing this in a way that is not onerous to the awardee.
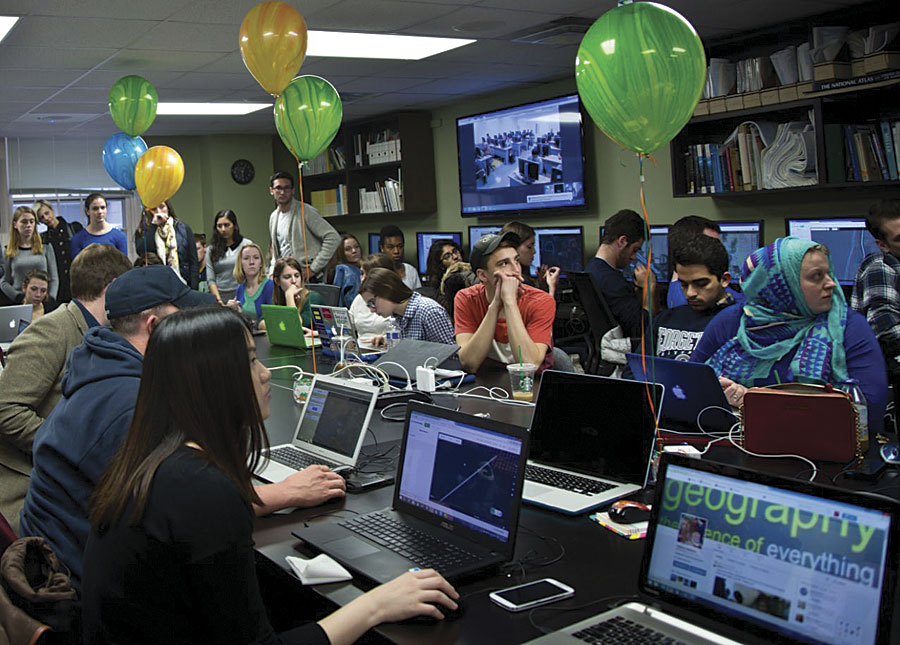
Youth Mappers in a chapter at Khulna University digitize field notes onto the map. They collaborated with two other chapters in the United States on this project. Photo/Chad Blevins
[Youth Mappers is a movement that is galvanizing university students to change the world for the better by mapping it. The fledgling network of university-based mapping chapters is creating maps that will help United States Agency for International Development (USAID) projects that focus on increasing food security; preventing diseases such as malaria; and responding to natural disasters in Asia, Africa, the Middle East, Eastern Europe, Latin America, and the Caribbean.]
Youth Mappers project director Patricia Solis at Texas Tech University calls it the Geospatial Revolution 2.0. “It’s more than a technical revolution—it’s something of a social revolution too,” said Solis. She described how students often pitch in and work on volunteered geographic information (VGI) projects aimed at helping developing countries respond to natural disasters or fight problems such as poverty, disease, and hunger. In the process, they learn about other places in the world and get the opportunity to connect to students from these areas.
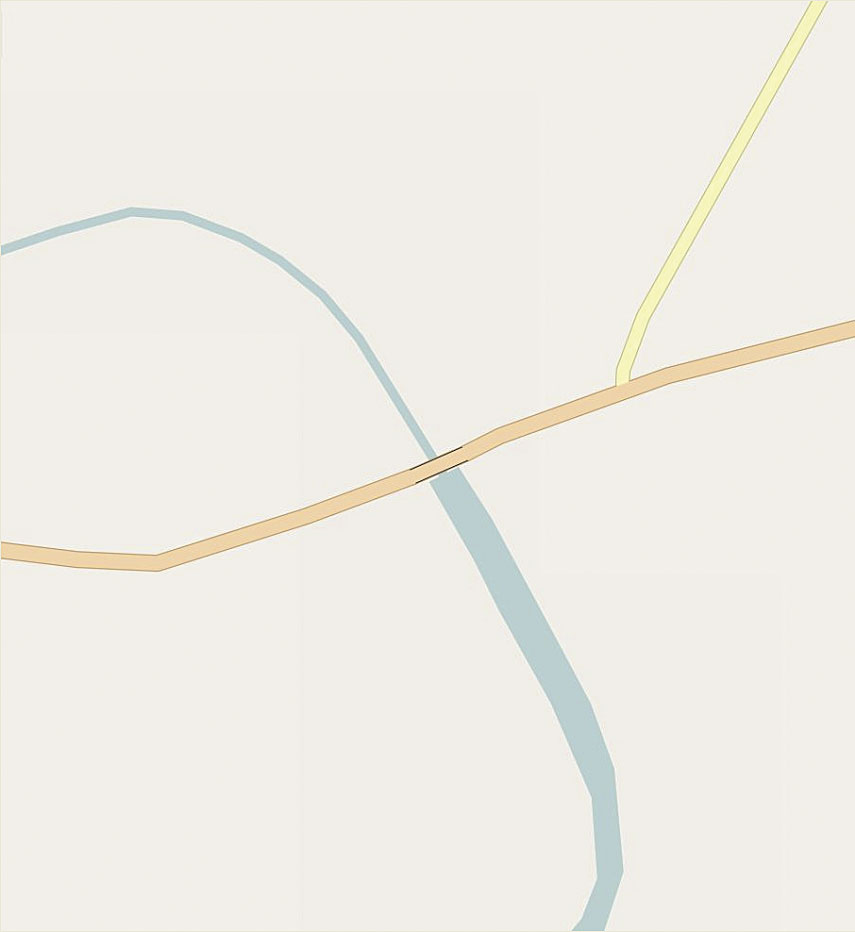
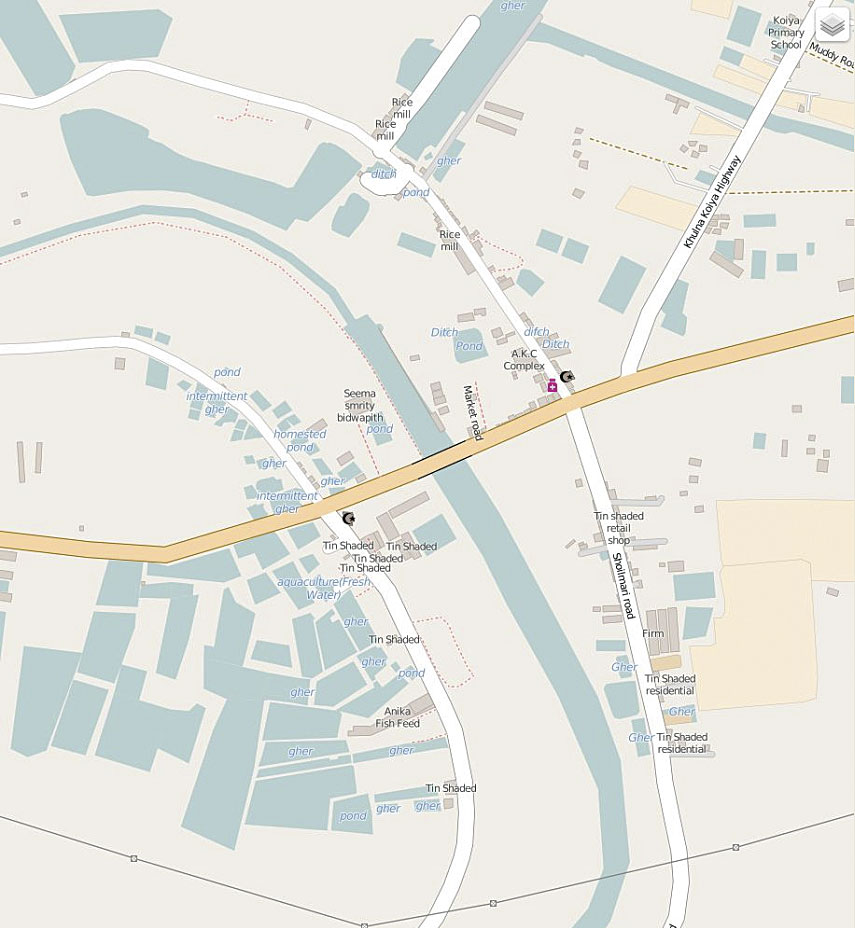
Last year, a chapter at Khulna University in Bangladesh and chapters in the United States at George Washington University and Texas Tech University collaborated to make a basemap of a rural community near Khulna, Bangladesh, where the US government’s Feed the Future initiative operates. Once the basemap was finished, the Bangladeshi students visited the area to collect detailed information such as the locations of bodies of water where high-protein fish and prawns are farmed. As part of efforts to improve food security, the map will help USAID better understand who has access to enough nutritious food to live healthy lives.
George Washington University students worked on the same rural area near Khulna, Bangladesh. The map will be used to support the US government’s Feed the Future initiative there. Photo/Heather Blevins
Students in developing countries know their communities and the land surrounding them well. They can add important information and a local perspective to maps, according to Carrie Stokes, director of GeoCenter, a USAID resource for expanding and institutionalizing the use of geospatial tools and analysis. (See “Mapping a Better World” on this page.)
“Many people in poverty feel they don’t have a voice in their own governance,” she said. “Give them a skill to define their world by mapping it [and] they feel empowered.”
Youth Mappers was formed under the auspices of the new Mapping for Resilience University Consortium. Julia Kleine, the Youth Mappers chapter president at Texas Tech University, said the group has great potential to help people in developing nations because of its international inclusiveness. “Youth Mappers gives people the opportunity to collaborate with students and youth from all over the world, ultimately creating a strong network of leaders in developed and developing nations that can face world issues together and be equipped with the tools to do so,” she said.
Most of the students who are drawn to Youth Mappers are those who have a drive for change and desire to give back to the world, said Kleine. This includes members who are international students from developing nations who are studying in the United States. Their reasons for getting involved are personal. They have experienced firsthand the struggles in the developing world and the lack of access to geographic data.
“If you can visualize the problems and visualize the solutions [with maps], that can bring us together to address development issues,” said Solis, who is also a research associate professor of geography at Texas Tech University.
Universities in the United States and in countries where USAID works are welcome to join the consortium. Students worldwide can participate in Youth Mappers chapters, mapathons, and research fellowships to create geospatial data for USAID projects in parts of the world where few maps exist. USAID awarded a $1 million grant in 2015 to the consortium.
The GeoCenter works with the consortium’s founding members, Texas Tech University, George Washington University, and West Virginia University, to build what Stokes calls a “virtual partnership” between students in the United States and students in developing countries. The cadre of international student mappers will then collaborate on making maps using OpenStreetMap (OSM).
Students use high-resolution satellite imagery to map features such as roads, bodies of water, houses, and schools. Using OSM tools such as Field Papers or OpenMapKit, students who live in or near the cities or villages being mapped will go into the field to collect more detailed information to add to the maps, such as road names, the number of students at area schools, or the types of building materials used in houses. The information created by these projects is made available through OSM.
Texas Tech, George Washington University, and West Virginia University chapters have hosted several mapathons to build maps requested by USAID. The events, which offer free pizza and training, attract a diverse crowd that includes students from outside the GIS and geography realms.
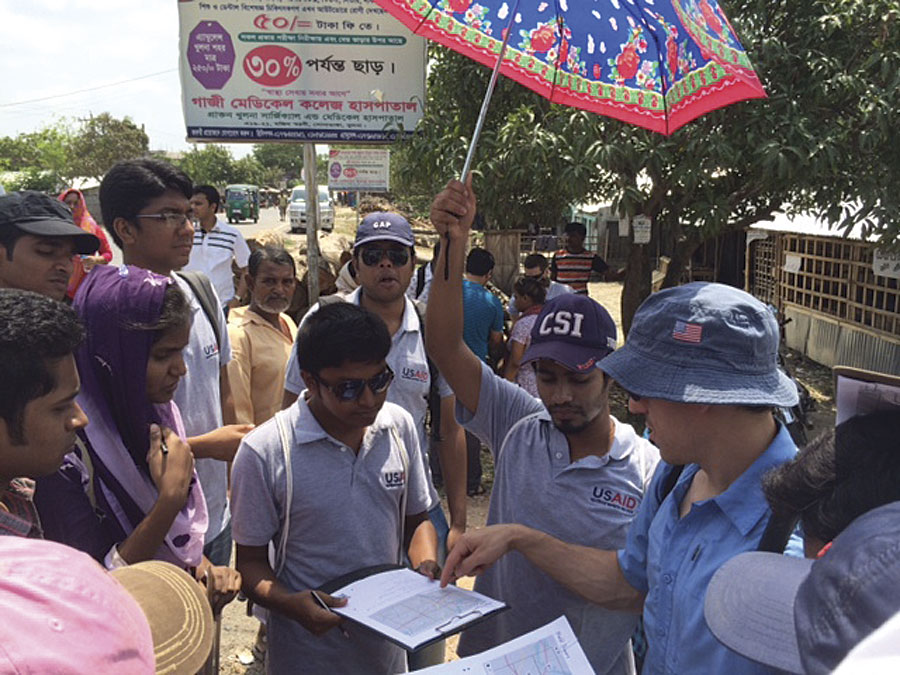
Chad Blevins from the USAID GeoCenter traveled to Bangladesh, where he provided instruction to Khulna University students as they prepared for a day of field mapping. Photo/Michael Crino
In November 2015, these three chapters held a lively mapathon to create a basemap of the African seaport city of Quelimane, Mozambique. Using high-resolution imagery from USAID, the students competed to see which school could map the most features, including houses and roads. An estimated 26,000 buildings and more than 1,000 roads were put into OSM during that mapping effort. The map, now populated with roads and houses, will be used to plan an anti-malaria campaign there. It will help malaria prevention workers plan where and how much insecticide to spray. “If you short-change yourself by not having enough insecticide,” said Stokes, “it affects the efficacy of the entire effort.”
Stokes points to a successful collaboration in 2013 between students at George Washington University and students from Kathmandu Living Labs. The GeoCenter and the World Bank’s Disaster Risk Reduction team mapped the city of Kathmandu in earthquake-prone Nepal.
George Washington University used satellite imagery to trace roads, buildings, and other infrastructure. The map features were subsequently validated on the ground by Kathmandu Living Labs students who collected attribute data for those features.
Texas Tech University’s Youth Mappers chapter president Julia Kleine helped create a map of the city of Quelimane, Mozambique.
When a magnitude 7.8 earthquake struck Nepal in April 2015, the George Washington University students enhanced the Nepal map on OSM, Stokes said. The GeoCenter downloaded the new map data onto GPS units that American search-and-rescue teams took to Kathmandu.
“It’s not just about tech. It’s really about making a difference in the world,” said Solis, who witnesses the enthusiasm among the students for these projects. “People care about people around the world when they know something about them,” she said.
And do they have fun? “We are talking about a gaming culture,” said Solis. “[Students] are motivated. They love the challenge of doing this. But most importantly, the learning potential for making real connections to other places and other students is profound. Youth Mappers not only builds maps, we also build mappers.”
Stokes knows that, in the years ahead, the work the GeoCenter does with the consortium to train and mentor the young mappers will be critically important. “We are not only creating the next generation of maps for USAID, but the next generation of mappers for the world,” she said.
For more information about the Mapping for Resilience University Consortium, contact mappers.vpr@ttu.edu. Get more information about the Youth Mappers chapters.
Lisa Terry surveys a reef. (Photo by John Melendez)
About a dozen St. Croix residents learned Monday evening how to identify coral bleaching and other reef disturbances and how to scientifically report them for monitoring purposes.
Lisa Terry, science technician and dive safety officer for The Nature Conservancy, made the training presentation on what residents need to know to become what she called “citizen scientists.”
BleachWatch is sponsored by The Nature Conservancy and falls under the umbrella of its Reef Connect program. The Reef Connect website was revamped in March and includes everything about BleachWatch, including Terry’s training presentation.
She said she was pleased with the way Monday’s event went. “They asked very good questions and were excited. She added that everyone present took the underwater survey forms that the “citizen scientists” will need to fill out to be part of the program, she said.
For St. Croix residents who missed Monday’s training event, another will be held at 5:30 p.m. Tuesday at The Nature Conservancy in Little Princess. Residents of St. John and St. Thomas will get a presentation on BleachWatch Virgin Islands during the first part of the second week of September. Terry said September and October are the months when bleaching is most likely to occur.
In June the National Oceanic and Atmospheric Administration said a third consecutive year of higher-than-normal sea temperatures could lead to an increase in coral bleaching around the world and in the Virgin Islands.
According to Terry, high school interns performed surveys around St. Croix during July and reported no bleaching, but did find instances of coral disease. However, she indicated that a couple of reports of bleaching on deeper corals were received from volunteers who were trained in years past. Some scientists believe that deeper coral, being protected somewhat from the warming surface waters, are the key to coral reef survival.
Terry told the Source that divers at TNC have “noticed some paling in some of the deeper plate corals but haven’t seen any-wide spread bleaching this year.”
When asked what she hopes BleachWatch will accomplish, she explained, “Coral bleaching is largely due to warming waters from climate change and while we, on a local level, might not be able to stop climate change by ourselves, we can monitor and track these events as they happen to determine which reefs are more or less resilient to bleaching. Then we can use this knowledge to inform further conservation efforts, like the creation of protected areas or reducing pollution or overfishing in areas that are already susceptible to bleaching so as not to compound their stress.”
The survey sheet filled out by the citizen scientists is detailed and includes instructions such as “Estimate the percent coral coverage and other observations using the BleachWatch VI Data Sheet. Record any other findings (ex.: number and types of herbivorous fishes, number and types of invertebrates, number and types of diseases, etc.) using the notes section. Take photographs at each of your five survey stations and of any important observations or organisms.”
For residents who don’t want to get into such detail but would like to report reef damage, there is a quick report section on the BleachWatch page. When you get to the “quick report” feature, pin the map where you saw the disturbance and select from a list of disturbances, including coral disease, marine debris, and anchor damage.
“We hope that, if nothing more, the program encourages community members and visitors to pay attention to what’s happening on our reefs and inspire them to get involved with conservation efforts.”
[The Woodrow Wilson Center in the District of Columbia has a special program on Citizen Science initiatives (sign-up information at the bottom of this post). This message from the Center’s Elizabeth Tyson highlights a Chinese water quality monitoring program which has several elements that might be adapted for someplace in the insular Caribbean, and which could be considered for a NatureTech award.]
Hi All –
For those of you following the development of citizen science and crowdsourcing in the People’s Republic of China, here is a succinct update on theInstitute for Public and Environmental Affairs flagship citizen science river monitoring initiative, “Foul and Filthy Rivers.” The unique program leverages a mobile application (Blue Map) for citizens to report “odorous or filthy areas” of rivers. What happens next is quite unique in the citizen science and policy realm in that the information reported goes straight to the municipal environmental protection agency and they have 7 days to investigate and close the claim. After 7 days the report becomes public.
The following is an update on the initial metrics of the program. These were compiled and provided to me by Kate Logan, an employee of IPE. For further information you can follow the hyperlink to WeChat (social media application in China) and use google translate to get further information.
Introduces the background of the government’s project and the coalition of environmetnal NGOs that are working to publicly supervise the initiative, inviting more volunteers and NGOs to join in their efforts
Guizhou is the only province where the number of �扈㈻� have actually decreased
Urges government to be more proactive in releasing results of cleanup efforts, and citizens to be active in supervising
Of 1846 reports from February 18 through the end of July, 1727 had been “resolved,” a rate of 94%
The highest number of reports came from Beijing (576), followed by Hunan (302), Guangdong (164) and Shandong (137)
A handful of provinces did not respond within the deadline of 7 days, with Liaoning not having a single instance of responding on time any of the ten complaints raised. Conversely, Beijing had a 100% rate of responding on time.
Complaints peaked on March 14 to 20, coinciding with World Water Day
The potential effect of grassroots NGOs can be seen in that there were a high number of reports in provinces with high environmental NGO activity — and in particular Hunan, where the number of waters designated for cleanup is relatively high, likely due to the active work of citizen reports. However, there are still some provinces with a discrepancy between the high number of reports and low number of waters designated for cleanup, which must be further examined and addressed”
Message via CitSci-discussion-L@cornell.edu, the discussion-based listserv for the community supporting citizen science, volunteer monitoring, and other forms of public participation in scientific research.
Markets for Good Launches Good Data Grants for a Higher Impact Social Sector
New grants program from Stanford PACS will fund research and innovation to help the social sector use data safely, ethically, and effectively to improve its work.
With the support of the Bill & Melinda Gates Foundation, the Good Data Grants program will focus on the role of digital data and infrastructure to improve decision-making in philanthropy (particularly individual giving) and in the social sector writ large.
Grants will be awarded for two types of projects: scholarly research and practical innovations. The program aims to support research, prototypes, and shared learning that can help donors and social sector organizations use digital data safely, ethically, and effectively to improve their work.
Lucy Bernholz, Senior Research Scholar at Stanford PACS and Director of its Digital Civil Society Lab, said of the new program: “We’re excited to support new ideas and innovations that will help nonprofits and donors boost their impact through the responsible and effective use of digital data. We’ll draw on the resources and expertise of the MFG and Digital Civil Society Lab communities to support grantees and help them share their work for the benefit of the entire social sector.”
The launch of the Good Data Grants program marks the first year of a planned three-year grants program. For its first year, Markets for Good will select 5 to 15 grantees to receive funding from a pool of $200,000. The deadline for proposals is September 30, 2016, and grants will be announced and awarded in November 2016.
Markets for Good will host three live webinars to discuss the grants program in detail and respond to questions from potential applicants (click below to RSVP):
Grantees will be invited to the Do Good Data conference at Stanford in February 2017 and will present the outcomes of their work to the MFG community in the fall of 2017.
Good Data Grants are intended to support researchers and innovators in developing new learning and tools that the entire social sector can use to improve the safe, ethical, and effective use of data in the digital age. All work supported by Good Data grants will be publicly shared and geared toward improving practice in the field.
ABOUT MARKETS FOR GOOD
Markets for Good (MFG) improves the data infrastructure for social good. We share ideas and support innovation to advance the safe, ethical, and effective use of digital data for a higher impact social sector. MFG facilitates the online exchange of expert and practical data-related knowledge through a robust online community, and we foster innovation and original research with grants and mentorship. We also host in-person events that foster knowledge sharing and ideation for the community, as well as cross-sector information sharing between public and private sector partners, and research on emerging relevant issues.
To learn more or schedule interviews, contact Erin Fogg at 831-515-6403 or visit marketsforgood.org.
ABOUT THE STANFORD CENTER ON PHILANTHROPY AND CIVIL SOCIETY
The Stanford Center on Philanthropy and Civil Society (Stanford PACS) is a research center where scholars, practitioners, and leaders come together to explore ideas for social change. Stanford PACS publishes the preeminent Stanford Social Innovation Review (SSIR). This interdisciplinary center works with 5 schools, 20 departments, and 100 faculty affiliates to catalyze innovative research and explore new ideas to improve philanthropy and strengthen civil society.
To learn more or schedule interviews, contact Erin Fogg at 831-515-6403 or visit pacscenter.stanford.edu.


")


