Links and resources for Innovation and Citizen Science projects with a schools focus, extracted from posts to the Cit-Sci Discussion list, by Nancy Trautmann <nancy.trautmann> and Mary Ellen Hannibal <maryellenhannibal>.
This book is designed for teachers: Citizen Science: 15 Lessons That Bring Biology to Life provides several case studies + 15 lesson plans representing a large range of citizen science projects and ways of integrating into science teaching.
The book Citizen Scientist by Mary Ellen Hannibal, as well as Caren Cooper’s book Citizen Science for big-picture narratives focusing on individual projects but also connecting them to the larger, contextual vision. Both books provide a way to integrate “science” into the broader humanities, including history and literature.
Look at the readings for a single lecture/ workshop for in-service teachers or MAT graduate students and the California Academy’s Citizen Science Toolkit for educators.
Also, Dunn, R. and H. Menninger. (2016) “Teaching Students to How to Discover the Unknown,” in D. Cavalier and E. B. Kennedy (Eds), The Rightful Place of Citizen Science. Tempe, AZ.
The four episodes of the PBS program The Crowd and the Cloud, which are free online, are superb and comprehensive.
[I don’t fully understand the operation or universe of potential or preferable applications of “Counter-mapping,” but then again, sometimes I have trouble figuring out how to apply GIS tools. It does seem, however. that these concepts could be useful in addressing the interface between local, artisanal users of natural resources, such as fishers, and new conservation needs and programmes. There is a useful list of references at the bottom of this article.]
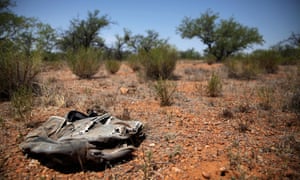
A weathered backpack left behind by a migrant in the Sonoran Desert between the USA and Mexico. Photograph: Alamy Stock Photo
Sara is a 32-year-old mother of four from Honduras. After leaving her children in the care of relatives, she travelled across three state borders on her way to the US, where she hoped to find work and send money home to her family. She was kidnapped in Mexico and held captive for three months, and was finally released when her family paid a ransom of $190.
Her story is not uncommon. The UN estimates that there are 258 million migrantsin the world. In Mexico alone, 1,600 migrants are thought to be kidnapped every month. What is unusual is that Sara’s story has been documented in a recent academic paper that includes a map of her journey that she herself drew. Her map appears alongside four others – also drawn by migrants. These maps include legends and scales not found on orthodox maps – unnamed river crossings, locations of kidnapping and places of refuge such as a “casa de emigrante” where officials cannot enter. Since 2011, such shelters have been identified by Mexican law as “spaces of exception”.
Travelling through tree-covered areas is a slow and arduous process, as is travel through politically unstable areas. Scale on an orthodox map is uniform; counter-maps can represent psychological as well as physical distances that are rarely linear or uniform. In the town of Duvergé in the Dominican Republic, I once interviewed a Haitian migrant who had dealt with civil unrest, a long mountain chain, forests, police checkpoints and clusters of militias (chimères) on his journey across the border. Although geographically his home town was only 177km away, he was psychologically about as close to home as a Londoner is to Murmansk.
Counter-mapping’s ability to capture this fragmentation also makes it a useful tool for documenting physical transformations wrought by climate change. In the Arctic, melting sea-ice is opening up the Northwest Passage to the possibility of greater transcontinental shipping. Questions of sovereignty over these waters are pressing, and the traditional function of maps has been to impose the stamp of a crown on vast swaths of the Earth. In the Arctic, as in Africa and Asia through the 19th century, it suited many Europeans, Russians and Americans to think the land was empty before they arrived. In the mining town of Labrador City, there are curiously named lakes: Tanya Lake, Beverly Lake, Carol Lake. Curious, until you learn that Carol was the wife of the chief geologist of the Iron Ore Company of Canada (IOC). The names date from the 1950s.
Counter-mapping often pays greater attention to “their method” than orthodox mapping. There are more than just Cartesian coordinates in the world. Detailed knowledge of the thickness of ice, places of shelter and predators are engraved in Inuit stories. Indeed, the naming continues; within the great Rapa valley in Sarek, the Swedish wilderness, is a small area recently given the name Rovdjurstorget (Predator Square) because the tracks of all four large predators that exist in the wild in Sweden (bear, wolverine, wolf and lynx) have been found there.
And if a scientist frowns at the mention of storytelling, just remind them of the names of places to be found in anatomical atlases of the brain – the amygdala (the almond) , the hippocampus (the seahorse) , the globus pallidus (the pale globe) . Mapping is eternally linked to stories, and counter-mapping acknowledges the use of more than one knowledge base. It also has the possibility to counter the naïve, sometimes malign, simplicity of state lines. Arctic people in particular know a thing or two about these lines – the Sami were often burdened with paying taxes to three nation states at a time.
One of the fundamental overlaps between the counter-mapping of the Arctic and the journeys of migrants is that in both cases there is no single scientific or technical solution to the problem at hand. Alleviating the problem depends as much on ethics as equations, and Inuit people have different ethical obligations to the Arctic to IOC geologists. The answer to the question “whose woods are these?” is not singular. Counter-mapping at least helps us to give more weight and representation to customs and claims on the land that have traditionally been ignored.
A growing movement seeks to make the tools of science available to everyone (including you)
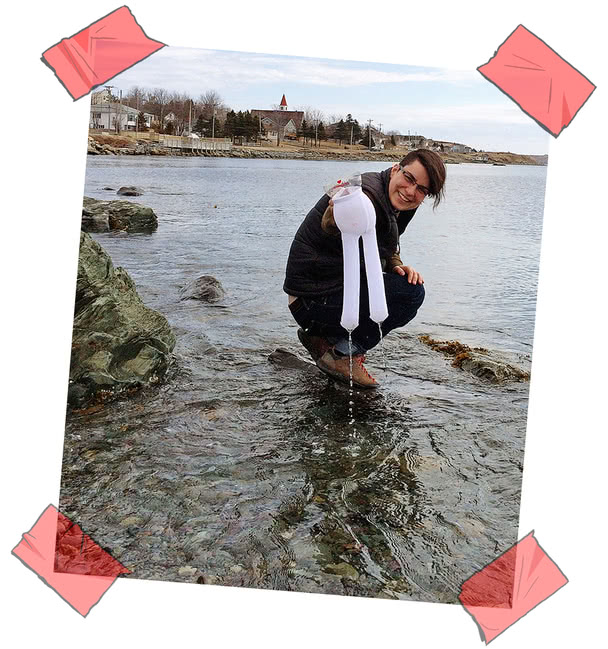
A PAIR of toddler’s tights. That is the most important component of the device that Max Liboiron designed to measure the ocean’s plastic debris.
In 2014 Ms Liboiron, a geographer, took up a job at the Memorial University of Newfoundland on the Atlantic coast. Two years earlier Canada’s Conservative government had passed a bill that weakened environmental protection and cut the budget for monitoring the country’s water and air. Ms Liboiron wanted to help plug the gap. She had no staff and no equipment. But she had a feeling that, if she could get around the second of those problems, she could sort out the first. Given appropriate tools, she suspected, locals would be more than happy to survey the waters surrounding the island for marine plastics. The ocean provides Newfoundlanders with food and jobs; knowing what ends up in the fish they eat and sell is crucial.
Newfoundland is not awash with fancy scientific equipment going begging. Baby stockings, however, are widely available. Attached to half a plastic bottle as a mouth and towed behind a boat, the synthetic tights (cotton will absorb water and sink) sieve surface water for some of the five trillion or so pieces of plastic that are estimated to pollute the world’s oceans.
BabyLegs, as Ms Liboiron has dubbed her contraption, is the sort of do-it-yourself kit being used by an increasing number of concerned citizens seeking to monitor the soil, water and air. Such tools are typically cheaper than the professionals’ alternatives. The Manta Trawls with which scientists skim the oceans for microplastics start at around US$3,500. BabyLegs, which you can put together yourself using instructions from Ms Liboiron’s Civic Laboratory for Environmental Action Research (CLEAR), costs just a few dollars.
But price is only part of the point. The bigger issue is agency. BabyLegs and schemes like it not only provide a cheap way to gather data governments are ignoring. They also offer citizens an active role in doing so; a way to help themselves, and express their commitment to others, on their own terms. It may look scrappy; it may be comparatively primitive (although, increasingly, it is not). But it is liberating. In 1977, in the very heavenly dawn of London’s punk-rock scene, a crude, photocopied magazine told its readers: “This is a chord, this is another, this is a third. Now start a band.” They did so by the thousand. Now that punk aesthetic has come to science.
Big in Japan
Safecast, an NGO based in Tokyo, provides the most comprehensive picture of radiation levels across Japan. Its data come from hundreds of devices, either assembled from Safecast’s kits (which cost $500) or built from scratch using instructions on their website. They consist of a Geiger counter, a GPS unit to log where measurements are made, a simple open-source computer called an Arduino to time-stamp the data and a memory card.
Pieter Franken, one of Safecast’s founders, started to map the country’s radiation levels a few days after the huge earthquake of March 11th 2011. When explosions ripped through the reactors of the tsunami-struck Fukushima Dai-ichi nuclear power plant, Mr Franken, a Dutch computer scientist working in Tokyo, bought a Geiger counter and went on the road. “On my first drive, the readings I was getting were significantly higher than those being reported on TV,” he says. Radiation levels varied dramatically from street to street; in some towns far from the plant they were higher than in those that were close.
The official data were not fine-grained enough to reveal such patterns. Results from Speedi, the government computer system used to predict the path of the radioactive plume from the plant, were considered too inaccurate to share with the public. No one trusted the government’s reassurances when they came.
“I met people on the ground desperate to know radiation levels in their home, school or at work,” Mr Franken says. He contacted two old friends, Sean Bonner and Joi Ito, tech entrepreneurs with colourful and impressive CVs, to talk about what to do. Between them, they cooked up the idea of using volunteers with mobile Geiger counters to collect data and stream them to a website.
Supplies of commercial instruments had, understandably, dried up quickly after the disaster. So Mr Franken patched one together from parts and connected it to an iPhone to get GPS co-ordinates for the data. By the end of the next month he and other volunteers had built a prototype of the “bGeigie”, the first in a series of detectors that they would make available in kit form on their site.
In the six years since the disaster, Safecast has moved from the fringes of respectable science to its mainstream. Two of its members were invited to speak in Vienna in 2014 at a meeting on the Fukushima disaster organised by the International Atomic Energy Agency. In 2016 the team published a paper in the Journal of Radiological Protection. And perhaps most tellingly of all, scientists are adopting their methods. “How Radioactive Is Our Ocean”, a project at the Woods Hole Oceanographic Institution in Massachusetts, is getting people to send samples of seawater from beaches on the west coast. The scientist leading the project, Ken Buesseler, met members of the Safecast team in 2012 shortly after he published a study on radioactive isotopes in the fish and waters off the coast of Fukushima. When he could not raise money from the federal government to look for those isotopes off America’s Pacific coast, he discussed with Safecast how to establish a citizen-science project to collect the data instead.
Citizen science has been around for ages—professional astronomers, geologists and archaeologists have long had their work supplemented by enthusiastic amateurs—and new cheap instruments can usefully spread the movement’s reach. What is more striking about bGeigie and its like, though, is that citizens and communities can use such instruments to inform decisions on which science would otherwise be silent—or mistrusted. For example, getting hold of a bGeigie led some people planning to move home after Fukushima to decide they were safer staying put.
Ms Liboiron’s research at CLEAR also stresses self-determination. It is subject to “community peer review”: those who have participated in the lab’s scientific work decide whether it is valid and merits publication. In the 1980s fishermen had tried to warn government scientists that stocks were in decline. Their cries were ignored and the sudden collapse of Newfoundland’s cod stocks in 1992 had left 35,000 jobless. The people taking science into their own hands with Ms Liboiron want to make sure that in the future the findings which matter to them get heard.
Swell maps
Issues such as climate change, plastic waste and air pollution become more tangible to those with the tools in their hands to measure them. Those tools, in turn, encourage more people to get involved. Eymund Diegel, a South African urban planner who is also a keen canoeist, has long campaigned for the Gowanus canal, close to his home in Brooklyn, to be cleaned up. Effluent from paint manufacturers, tanneries, chemical plants and more used to flow into the canal with such profligacy that by the early 20th century the Gowanus was said to be jammed solid. The New York mob started using the waterway as a dumping ground for dead bodies. In the early part of this century it was still badly polluted.
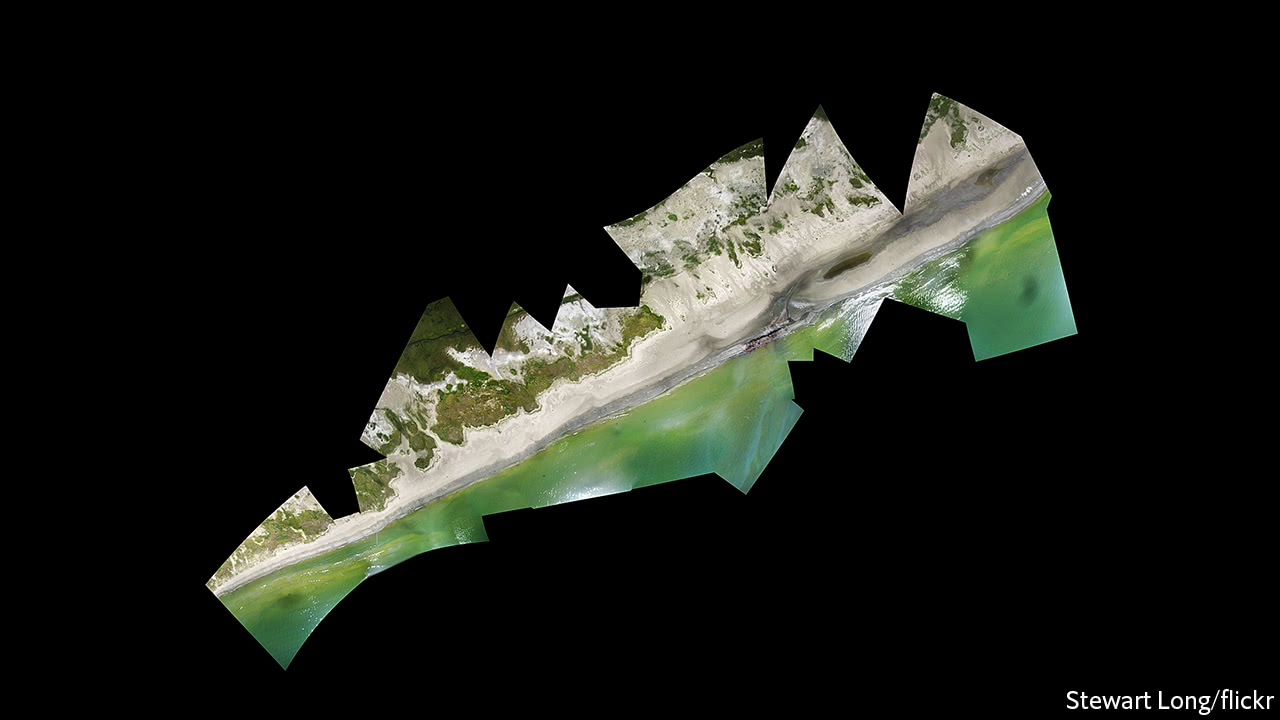
In 2009 Mr Diegel contacted Public Lab, an NGO based in New Orleans that helps people investigate environmental concerns. They directed him to what became his most powerful weapon in the fight—a mapping rig consisting of a large helium balloon, 300 metres (1,000 feet) of string and an old digital camera. A camera or smartphone fixed to such a balloon can take more detailed photographs than the satellite imagery used by the likes of Google for its online maps, and Public Lab provides software, called MapKnitter, that can stitch these photos together into surveys.
These data—and community pressure—helped persuade the Environmental Protection Agency (EPA) to make the canal eligible for money from a “superfund” programme which targets some of America’s most contaminated land. Mr Diegel’s photos have revealed a milky plume flowing into the canal from a concealed chemical tank which the EPA’s own surveys had somehow missed. The agency now plans to spend $500m cleaning up the canal.
Jeffrey Warren, who created MapKnitter, is one of the founders of Public Lab. The group was set up to help locals map the devastation caused by the oil spill in the Gulf of Mexico in 2010. When the Deepwater Horizon rig exploded, Mr Warren was studying digital cartography as part of a master’s degree at the Massachusetts Institute of Technology. Wanting to help but lacking local knowledge, he called the Louisiana Bucket Brigade, an environmental group in New Orleans, and was put through to Shannon Dosemagen. The brigade is named after the plastic buckets it provides to residents concerned about refineries in the area to help them in gathering samples for laboratory analysis. This has often revealed levels of toxic chemicals, such as benzene, many times higher than those allowed by law. Those data have helped local people, who are often poor and black, to lobby for change.
Tapping in to her experience with the brigade, Ms Dosemagen, who is now Public Lab’s executive director, rapidly organised training sessions in a New Orleans park. Cameras on balloons and kites began snapping the oil’s progress; MapKnitter joined the pictures together to show the impact of the slick (see photo above). Seven years on, Public Lab still springs into action after industrial accidents. Within days of Hurricane Harvey’s landfall in Texas last August coastguards asked Mr Warren for volunteers to help track chemical spills by combing through aerial photos.
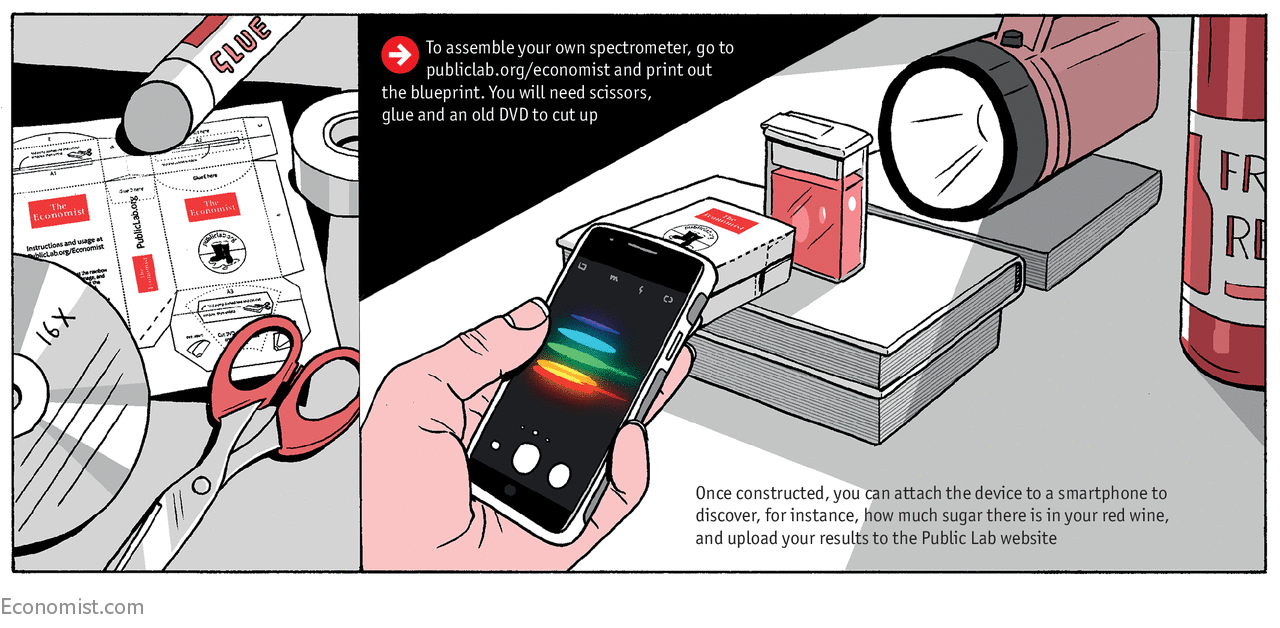
Public Lab’s website now hosts discussion boards on topics that range from finding decibel meters for smartphones to detecting metal ions in water, along with a range of impressive tools. In line with its do-it-yourself ethic, the site offers no ready-built equipment; those who build their own devices, Public Lab believes, are more likely to use them. There are instructions for converting a camera to take infrared images that will help determine crop health as well as for spectrometers which can show up the chemical composition of a liquid or gas by analysing light shone through it. Using a design PublicLabhas kindly made available at its website to readers of The Economist, you can build one yourself, either just for the fun of it, or to measure the sugar content of your wine, or for some punk’d up purpose of your own.
A similar ethos is also beginning to seep into university labs and research institutes. Cheap 3D printers and computer-aided design programs that allow design files to be shared online mean that ever more apparatus can be made in the lab, rather than ordered from a catalogue. The economic argument for doing so is compelling. A plastic test-tube rack can cost more than $20. Downloading one of the many different files for the rack of your choice and printing it costs a tenth of that. A $1,000 laboratory jack for lifting and levelling equipment can be made for $5.
X-ray spex
It is not just simple pieces of lab equipment that can be printed. Earlier this year Tom Baden of the University of Sussex and his colleagues published plans for a 3D-printable fluorescence microscope, called FlyPi, which uses ultraviolet light and fluorescent dye to improve its analysis of samples. Mr Baden estimates that it can be set up for less than $250. Flashy commercial microscopes on the same lines can cost thousands of dollars. Mr Baden, a neuroscientist who studies the eyes and brains of zebra fish, says that although the quality of a FlyPimay not be that of a commercial model, the low cost means that his lab can have several extra microscopes on the go at once alongside the high-spec one they already had.
“Open hardware” like the FlyPi is a boon for scientists in poor countries. Mr Baden and fellow neuroscientists Lucia Prieto-Godino and Sadiq Yusuf founded TREND in Africa, an NGO that organises summer schools for researchers. Courses on open labware begin with building a printer which can itself be made largely from printed parts. Printed scientific tools can be repaired cheaply, as can the printer.
Joshua Pearce, an engineer at Michigan Technological University in Houghton, believes the time is now ripe for change. Even mass-produced plastic trinkets and household goods are cheaper to print than to buy. “If we can beat the shower curtain ring-makers,” he says, “the equipment manufacturers have got no chance.”
Mr Pearce, an early advocate of open hardware, is pushing the concept hard. Atomic layer deposition (ALD) is a method of building up very thin, uniform films on a surface. In chip manufacturing, the process can lay down transistors that are no more than a 100 atoms across. Engineers are exploring its potential for making thin, wearable sensors, implants and drug-delivery devices.
Many researchers would love to get their hands on a system but, at a cost of $250,000, few can afford it. That cost reflects the sophistication of the kit required to carry out the enterprise. ALD must take place in a carefully controlled vacuum. Mr Pearce, however, wants to produce one that anyone can make in the lab for a fraction of the cost with printable plastic parts.
Hundreds of scientists like Mr Pearce and Mr Baden are uploading their plans for instruments to the internet, where they are scrutinised by citizen scientists hoping to improve the tools they are using, and thus the things they can study, monitor and make a fuss about. As new, cheaper, easier-to-use instruments become available, more people across the world will step into the breach as governments threaten to scale back their efforts to monitor the environment and set their own agendas.
In Chile, Exploratorio Sombrero hopes to map poorer neighbourhoods of Melipilla, the city where it is based. In Indonesia, Lifepatch has helped farmers whose land was engulfed by a volcanic eruption. Safecast is growing, too. In April, it unveiled a solar-powered device that can detect levels of particulate air pollution as well as radiation. Within two years, Safecast plans to have more such sensors in America than the EPA. That will improve national statistics at a time the government shows little interest in doing so; more important, it will empower communities which never had the knowledge to affect their futures before.